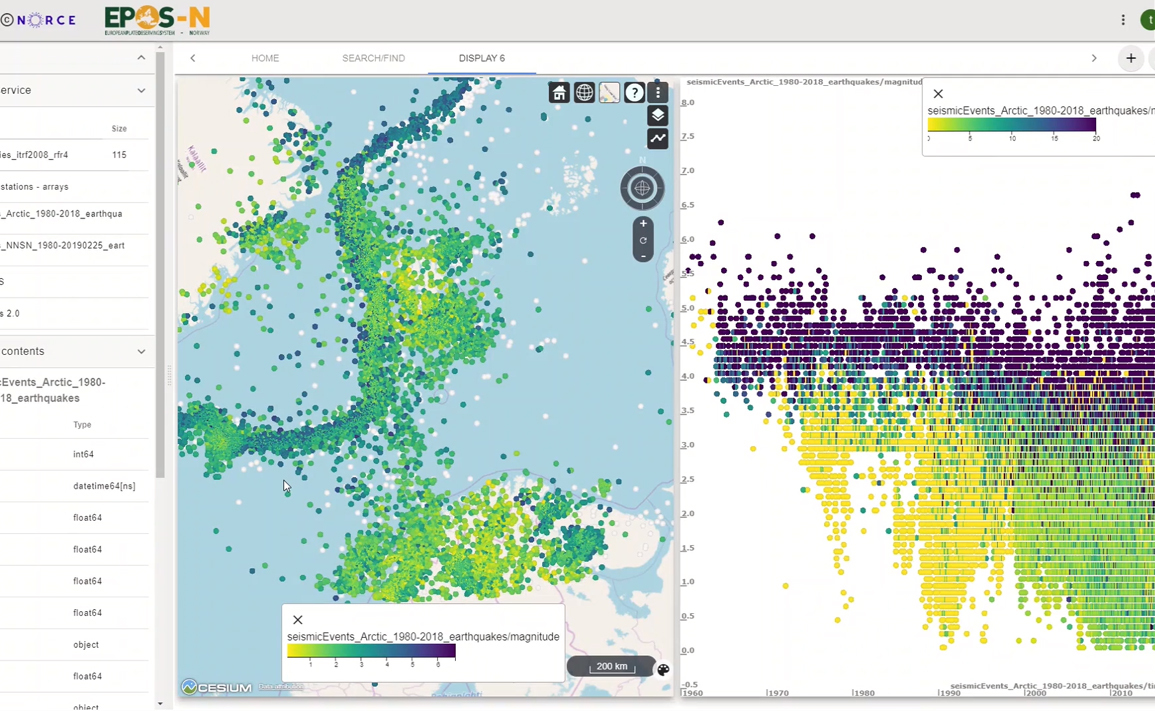
This animation above illustrates visual analysis of earthquakes where the user changes the selected geographical area in one plot, and it shows how the magnitude and the number of stations capturing each event (illustrated with color) change in real-time with this selection.
Researchers and policymakers are target groups
– By integrating data from many national infrastructures with measurement stations, a better understanding of risk is achieved, providing full data access to researchers and policymakers, says Langeland.
An example of a integrated visual analysis would be to retrieve seismic events in an area, see if there is loose material , steep surrounding terrain and whether critically important infrastructure is nearby - either below sea level or on land. The EPOS-N portal also includes data on geology and faults - important when assessing risks of collapse and earthquake, says Langeland.
The portal includes large amounts of historical data. Also, data is continuously collected from many other sources, including seismic stations: seismometers that record the earthquake shakes, and GPS stations.
– GPS stations record position over time (movements can cause stress build-up in the earth's crust which in turn can cause earthquakes). As mentioned, we have geo-models and other types of measurements, Langeland says.
The Norwegian project has been in running since 2016, with funding from the Research Council of Norway's Infrastructure Program.
An important user group of the EPOS-N portal is researchers, but also state and municipal decision-makers are important users.